












F05 · Our own product
Every panel in the field, on one screen.
The Energy Monitoring Platform reads the energy analyser and the reactive-power controller in three-phase panels; it shows consumption, power factor and inductive/capacitive ratios without delay and warns before a limit is crossed.
We choose and wire the hardware, and we wrote the software. There is no third company between the meter and the dashboard.
Status
MVP ready · first field installation October 2026 (Teltonika TRB145)
How it works
Four steps from measurement to decision
A reading in the panel is on screen within a minute, and on your phone if needed.
- 01
Panel
The energy analyser (ENTES EPM-07S) measures voltage, current, power and energy; the reactive-power controller (RGSR) reports step status and alarm bits. Current transformers clip onto the existing busbar.
- 02
Field gateway
The RS485 Modbus line connects to a 4G gateway. Readings are taken every 10 seconds and condensed into 1-minute summaries; if the link drops, they are buffered on the device and sent when it returns.
- 03
Platform
Data arrives over encrypted MQTT and is compared with per-site limits. Reactive ratio, power factor and consumption summaries are computed; every skipped record is logged with its reason.
- 04
Action
Limit breaches, phase loss, lost communication and correction faults become alarms and are sent by email. The monthly energy report comes out ready as PDF and Excel.
Dashboard
The software's language: readable data
An example of what you see on screen. Values come from the simulator; on a real site the same place shows your real panel.
Demo Site 2 · Main panelSIMULATIONLIVE
- Instantaneous power
- 142.6 kW
- Consumption today
- 2,184 kWh
- Power factor (cos φ)
- 0.96
- Inductive ratio
- 12.4%limit 20%
- Capacitive ratio
- 1.1%limit 15%
- Correction steps
- 6 / 12engaged
Recent events
- Inductive ratio approaching limit: 18.7%14:02
- Gateway connection re-established13:41
- Current imbalance on phase L3: 9%11:20
Screens
Screens from the application
Real screenshots taken in the development environment with simulator data, not design mock-ups.
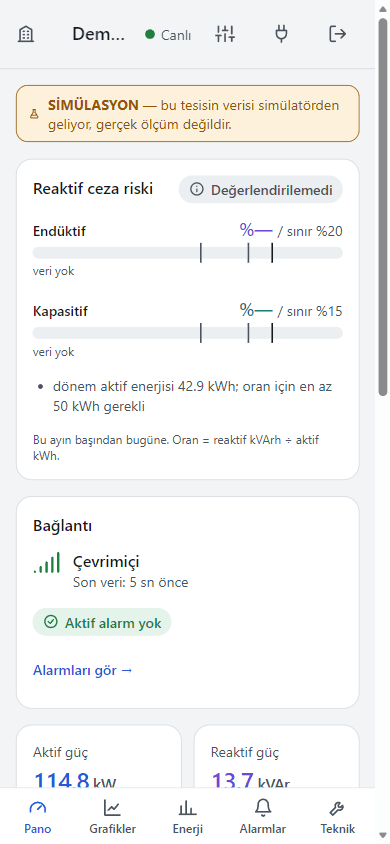
Installable on a phone (PWA) 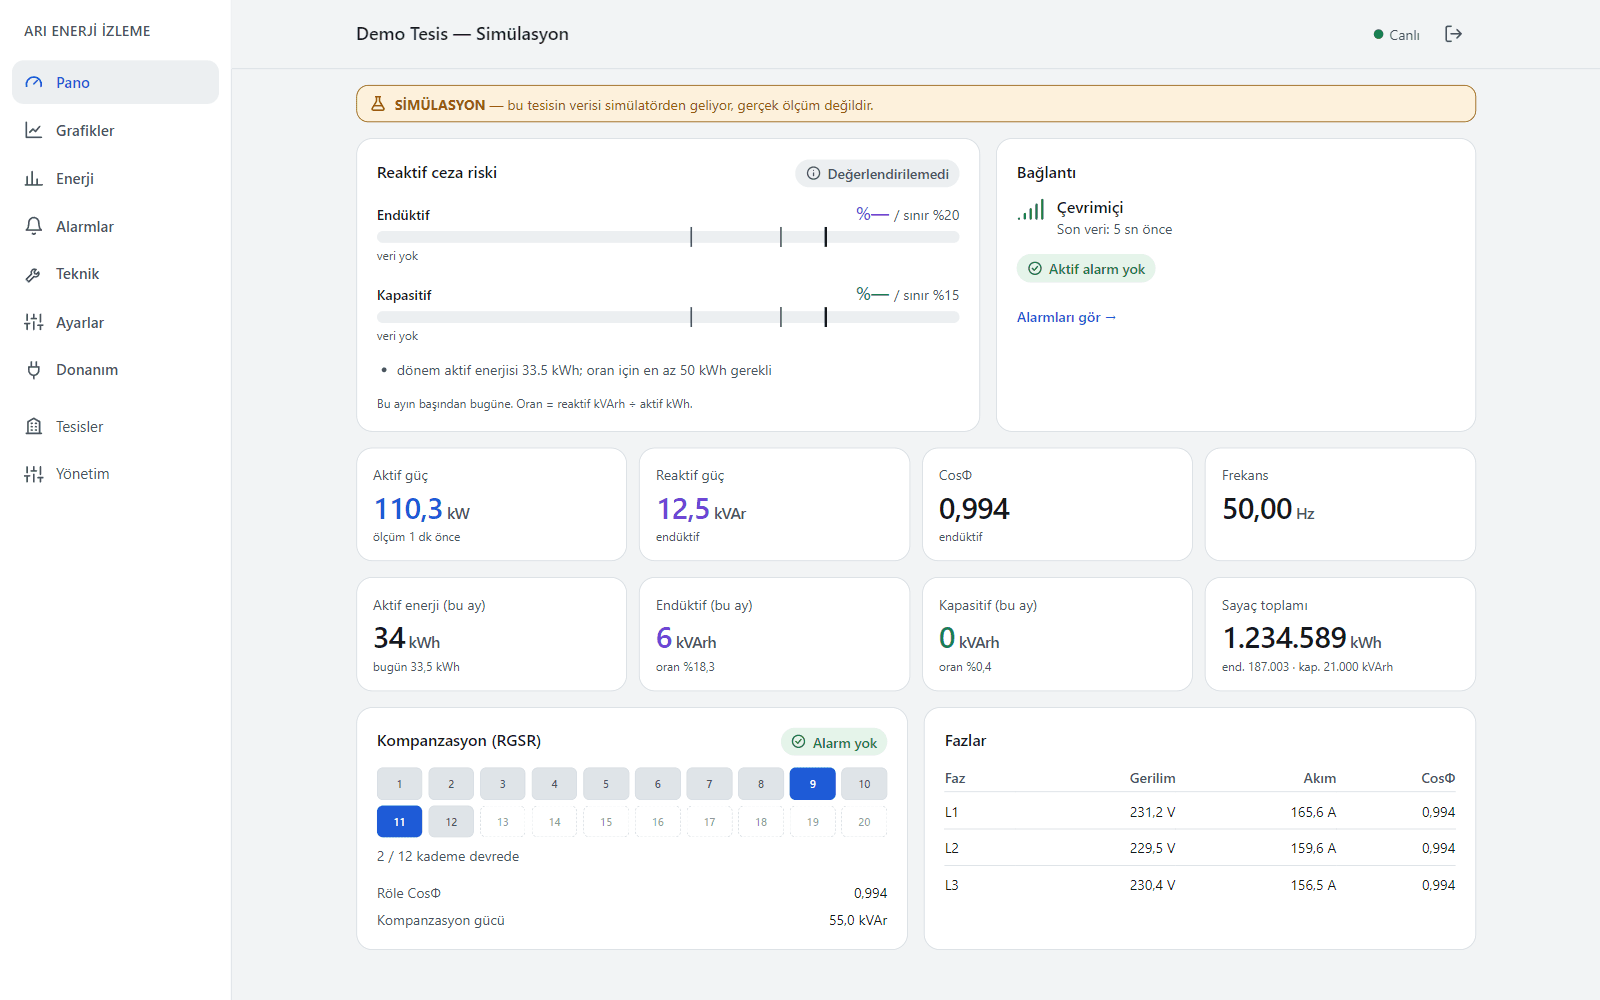
Overview: sites, instantaneous power and risk level 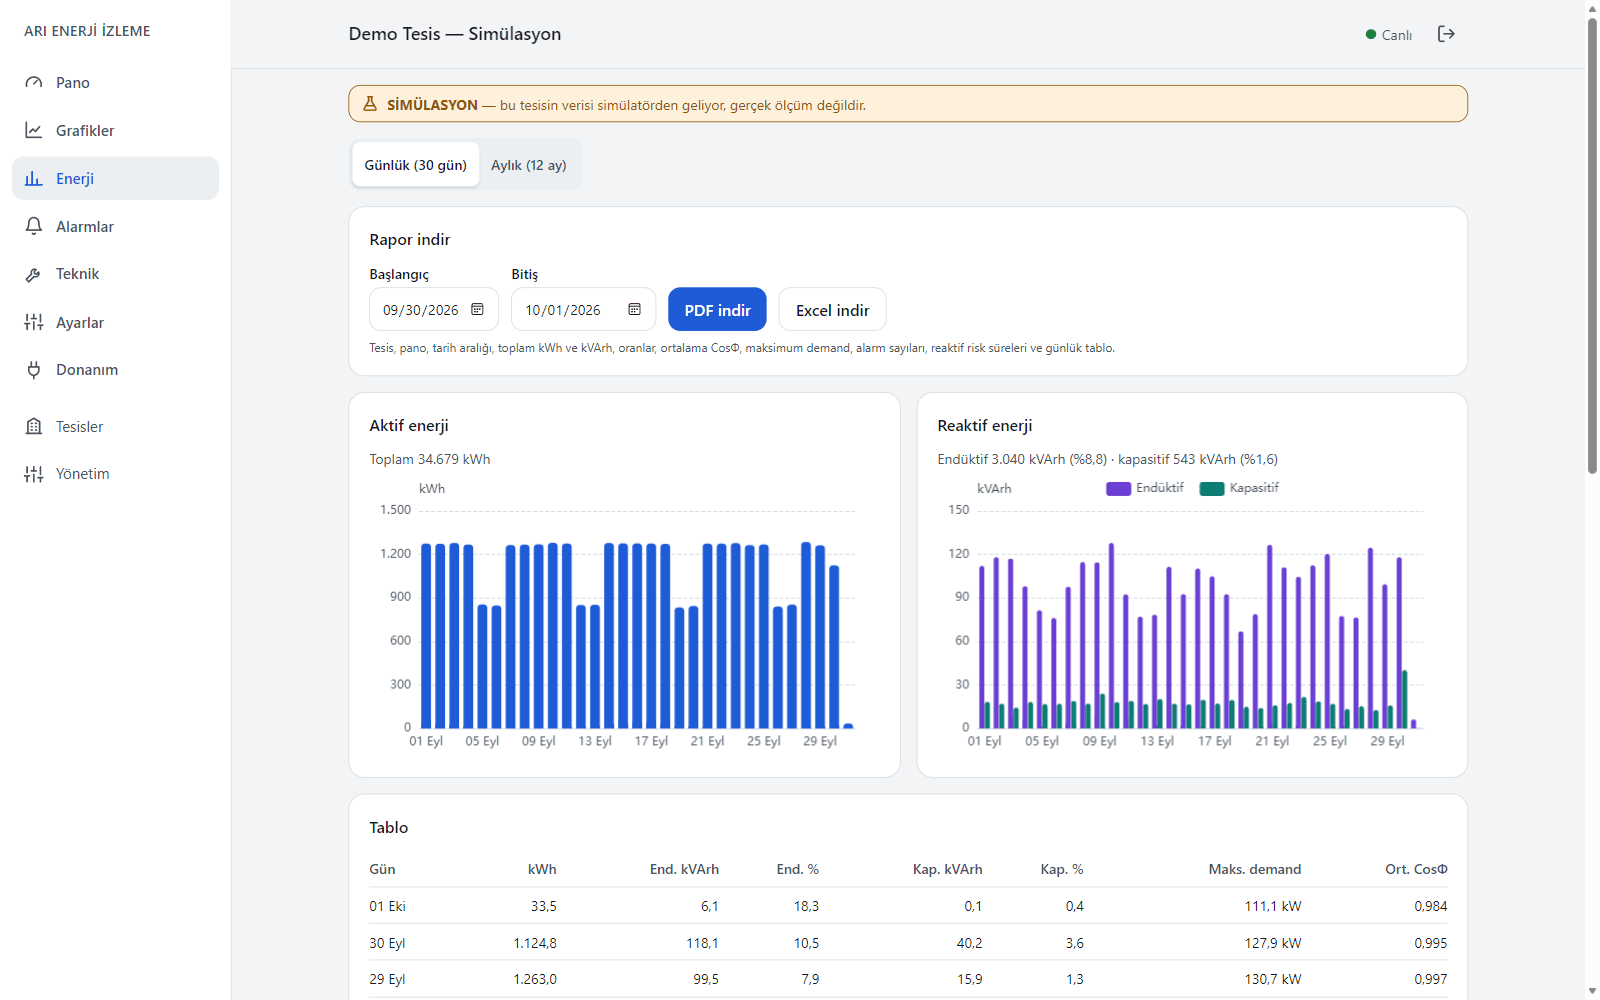
Energy: hourly and daily consumption, report download 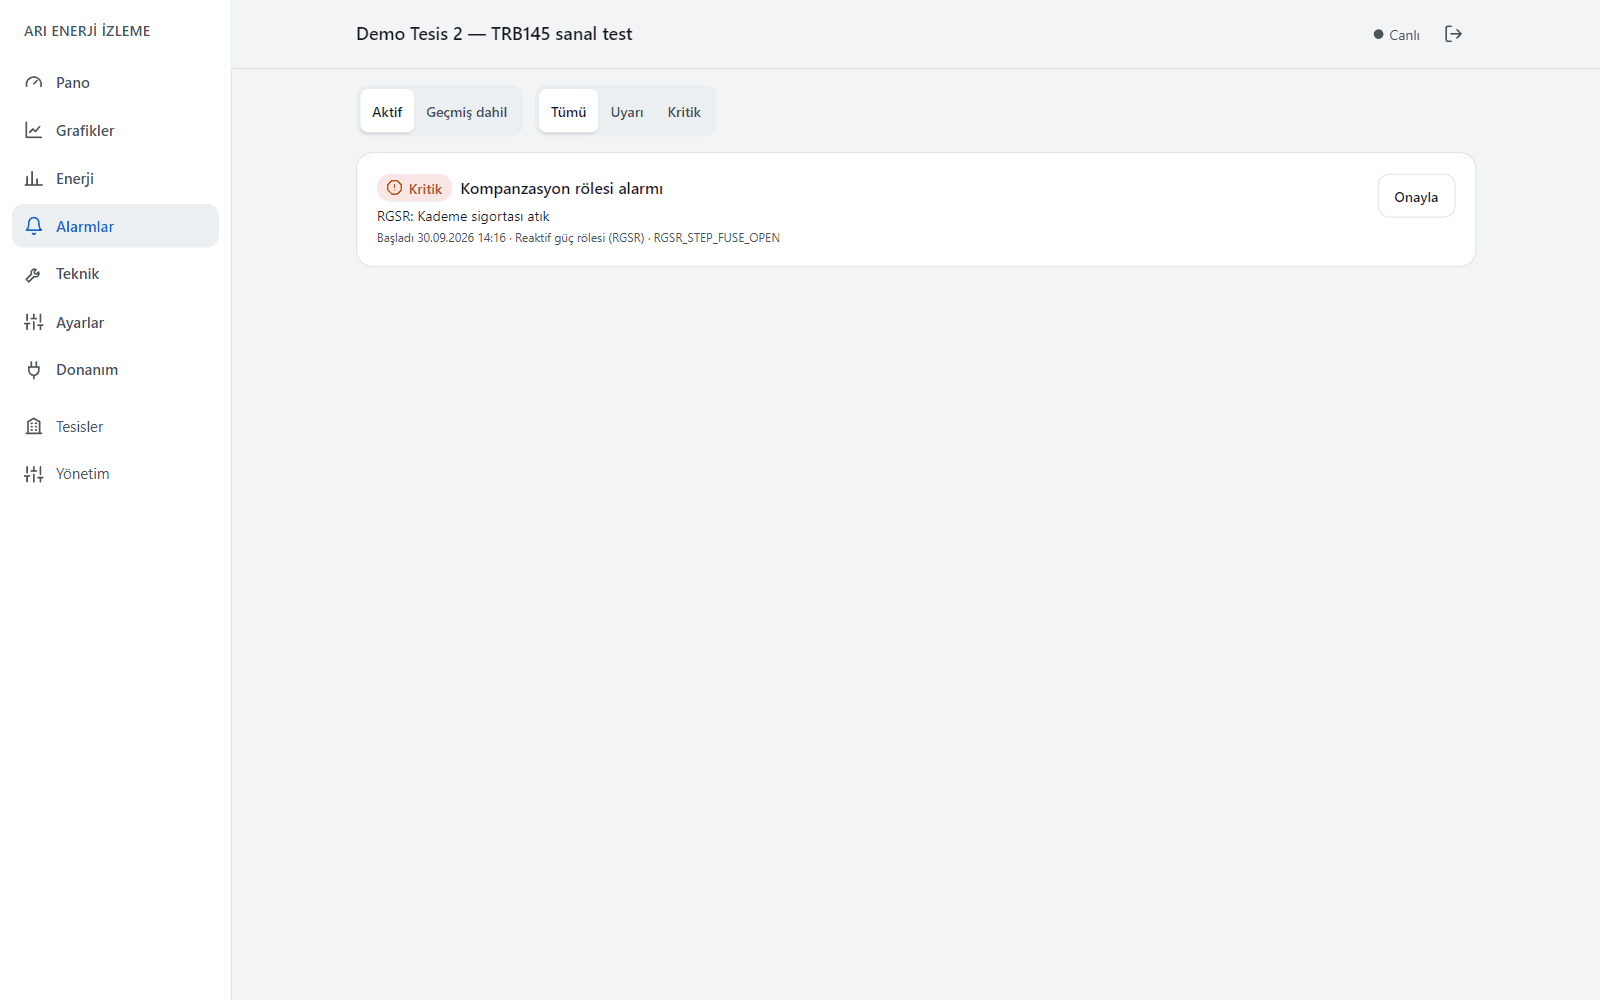
Alarms: open and cleared events, with their causes 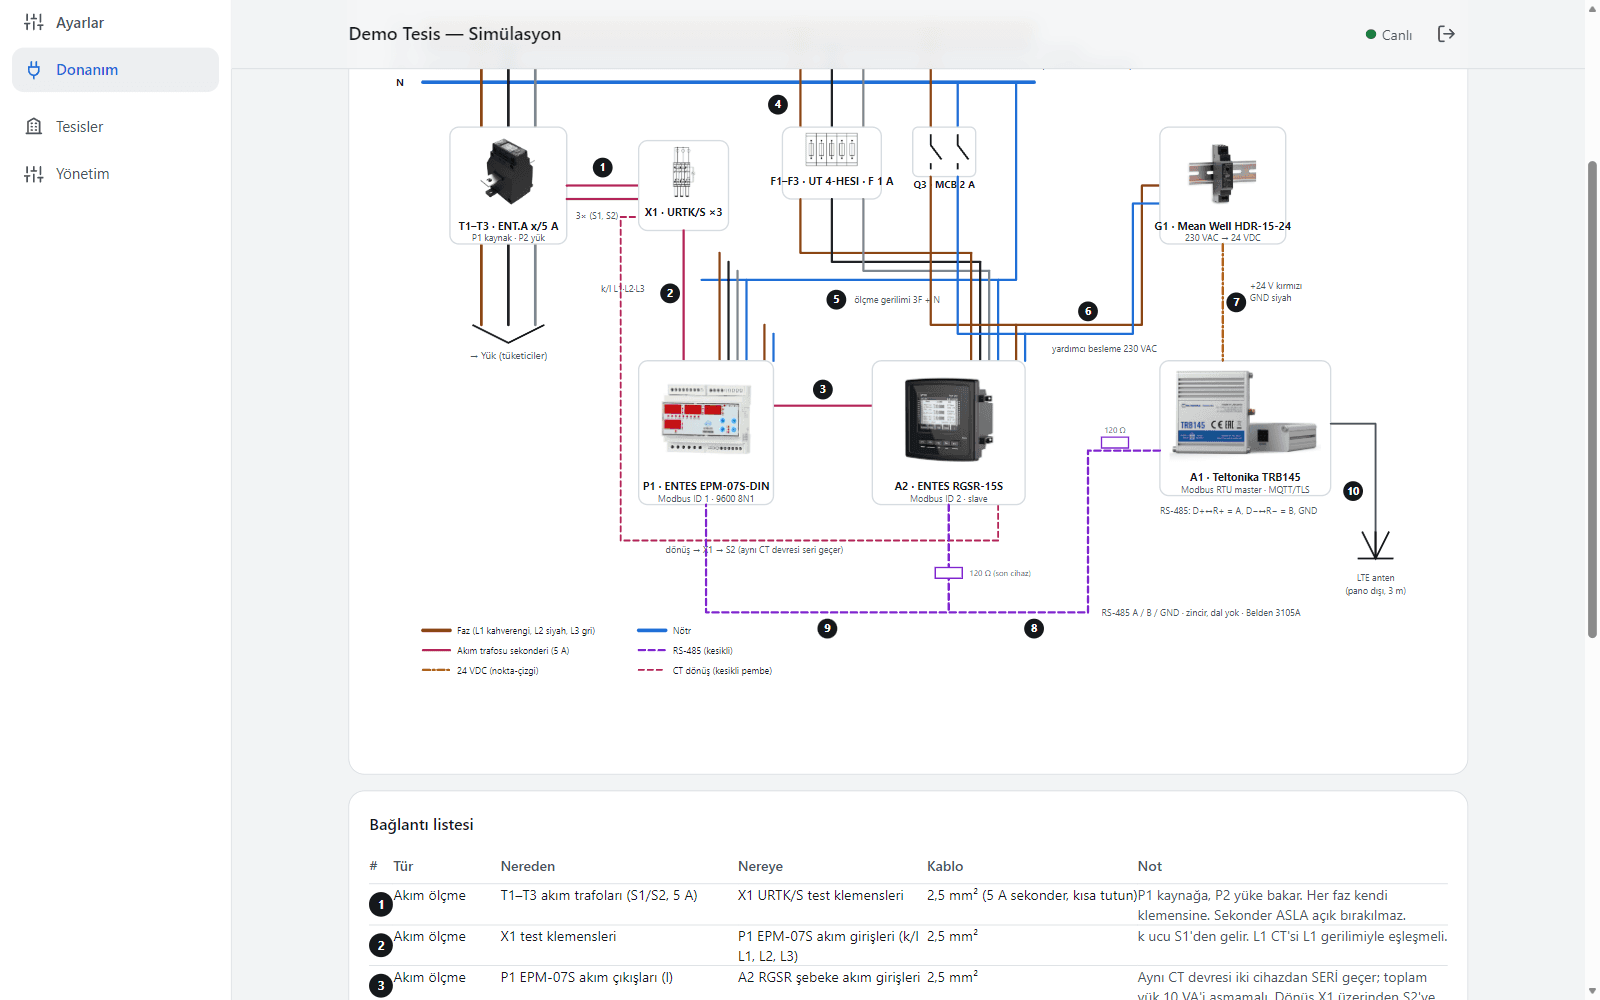
Hardware: panel wiring and single-line diagrams
Modules
Nine modules, one panel's data
All of them are fed by the same analyser and controller readings. MVP modules install today; project-based ones are planned together around your site's hardware.
 EPM-07SIn the MVP
Energy monitoring
See where the bill goes.
Active energy, instantaneous power and load profile on main and sub-panels. Hourly, daily and monthly consumption; comparison across sites.
- Active and reactive energy counters
- Load profile and peak demand
- Breakdown by site and panel
 EPM-07S + RGSRIn the MVP
Reactive power and correction
Warns before the penalty hits the invoice.
Inductive and capacitive ratios are compared continuously with per-site limits; step status and the controller's alarm bits are read. Limits live in the site record, not in code.
- cos φ and ratio tracking
- Step status, capacitor faults
- Limit-approach warning
- EPM-07S + RGSRIn the MVP
Power quality
Catch harmonics and imbalance early.
Voltage and current THD, phase imbalance and voltage deviations are tracked. Distortion that shortens equipment life becomes visible before a failure.
- THD (voltage / current)
- Phase imbalance
- Out-of-band voltage warning
- PlatformIn the MVP
Alarm and risk engine
The right event to the right person.
Limit breaches, phase loss, lost communication and correction faults become alarms; the site's risk level is kept with its duration history. The record stays after the alarm clears.
- Per-site thresholds
- Risk level history
- Queued email notifications
- PlatformIn the MVP
Reporting
The month-end report writes itself.
Energy and reactive-ratio reports are produced as PDF and Excel. The admin screen holds customers, sites, panels, gateways and users; nothing is deleted, only deactivated.
- PDF and Excel energy report
- Many sites, many users
- Role-based access
 Platform + 4GProject-based
Remote monitoring and intervention
See it without a site visit, act if needed.
All sites on one map from the control room or a phone. Remote step and load commands are engineered according to what the controller and gateway on site support.
- Many sites, one screen
- Instant phone notifications
- Remote commands: project-based
 Inverter (Modbus)Project-based
Solar plant monitoring
Generation and consumption on the same chart.
On rooftop and ground-mounted plants the inverter data is read through the same gateway; generation, self-consumption and energy exported to the grid are shown alongside consumption.
- Inverter and string monitoring
- Performance ratio
- Generation–consumption balance
- PlatformProject-based
Cost and carbon
Read every kilowatt-hour in money and carbon.
Cost by tariff and time band; the CO₂ equivalent of consumption. Comparable with the invoice, allocatable by department.
- Tariff-based cost
- Allocation by department
- CO₂ equivalent
- Charger / BESSProject-based
EV charging and storage
Chargers and batteries in the same energy picture.
Charger usage and the charge–discharge state of a battery storage system are added to the site's load profile and planned so that peak demand is not exceeded.
- Charger usage tracking
- Battery charge–discharge state
- Peak demand management
Capabilities
Six core capabilities of the platform
Whichever modules you install, these always run underneath.
Real-time monitoring
10-second readings, 1-minute summaries; the screen updates over WebSocket without a page reload.
Per-site limits
Reactive limits and thresholds are not hard-coded; they live in the site record. If a limit is undefined, the engine does not invent one and produces no level.
No silent errors
Unreadable registers, skipped packets and dropped links are logged with their reason. A system running incomplete says so.
Tenant isolation
Each customer sees only their own sites; out-of-scope requests return 404. One account for multi-site companies.
Outage-tolerant field side
When the link drops, the gateway buffers readings and sends them in order when it returns. Queued messages are not lost.
Installs on a phone
The interface is an installable web app (PWA); no app store needed, it is added to the phone and the desktop.
Integration
We do not replace your panel. We read it.
If an analyser is already there, we connect to it; if not, we choose and fit one. The software runs in the cloud or on your own server.
Field hardware
Verified with the ENTES EPM-07S analyser and RGSR reactive controller; other analyser brands are added with a register map. Current transformers clip onto the existing busbar.
Communication
RS485 Modbus RTU → Teltonika TRB145 4G gateway → MQTT over TLS. Direct connection on sites with Ethernet and Modbus TCP.
Software interfaces
REST API and WebSocket; your data can be exported. Report and alarm hand-off to ERP or maintenance software is engineered per project.
Deployment
Multi-tenant in the cloud or on your own server with Docker. The database schema and source code stay with you.
Sectors
Same platform, different panels
For every site exposed to reactive-energy penalties.
Factories and industrial zones
Feeder-level consumption and correction tracking across many panels.
Substations and infrastructure
4G readings at remote points, alarm on lost communication.
Solar plants
Generation and consumption on one screen; power factor at the grid connection point.
Commercial buildings
Malls, hotels, hospitals: cost allocation by floor and department.
Campuses and municipalities
Scattered buildings in one account, on one map.
The difference
Month-end invoice versus live dashboard
Today
- Consumption is learned from the invoice at month end
- Nobody notices a failed correction until the penalty is charged
- Nobody knows which feeder draws what
- Someone prepares the report by hand
With the platform
- Consumption and cost on screen with a one-minute delay
- Warning as the ratio nears the limit, alarm when it crosses
- Breakdown by panel and feeder
- PDF and Excel reports on their own
Honest limits
- The platform is at MVP stage; the first real field installation is scheduled for October 2026. The screens on this page were taken with simulator data and carry a SIMULATION badge in the application.
- Register maps come from ENTES documentation; points the documents do not state are marked unverified and are measured during commissioning.
- The solar, cost-carbon and EV charging modules are engineered around your site's hardware; they do not ship out of the box today.
Want to see your panel remotely?
Start with one panel. Tell us your analyser's brand and whether the site has 4G coverage for the gateway; we quote after the survey.
Request a demo